At the end of my earlier article on durability, I left one line: at the same level of fitness, female athletes seem to have the edge in durability, and that deserved an article of its own. I even said "see you in the next one." Then a few other topics cut in line, so this one's late. Here it is.
Quick recap: durability is about fading slowly. Lasting a long time is a different thing. After 2 hours of cycling at heavy intensity, critical power drops 10% on average, but some people lose less than 1% and others nearly 32%. And that drop is exactly what decides whether you can still run those last 42 km.
So the question is: is there a systematic difference in that drop between men and women?
Big data from the running world has been saying it for years: men slow down more than women in the second half of a marathon, and they hit the wall more often. But that kind of data has a hole nobody can close. Maybe women hold up only because they start more conservatively. That would be pacing strategy and would have nothing to do with physiology. The only way to separate the two is to put men and women in the same lab, on the same protocol, at the same relative intensity.
In 2026, someone finally ran that experiment. Two of them, actually: one in running and one in cycling, and they point the same way.
1. Two Experiments, One Answer
The first one looked at running.[1] The researchers recruited 11 male and 11 female trail runners and performance-matched them: each group sat at an equivalent level within its own sex, so nobody was pitting elite men against recreational women. The test was simple. First, a 12-minute all-out uphill time trial while fresh, as a baseline. On another day, a 3-hour run at moderate intensity, with another all-out time trial at the end of every hour, to see how much fatigue took off their maximal output.
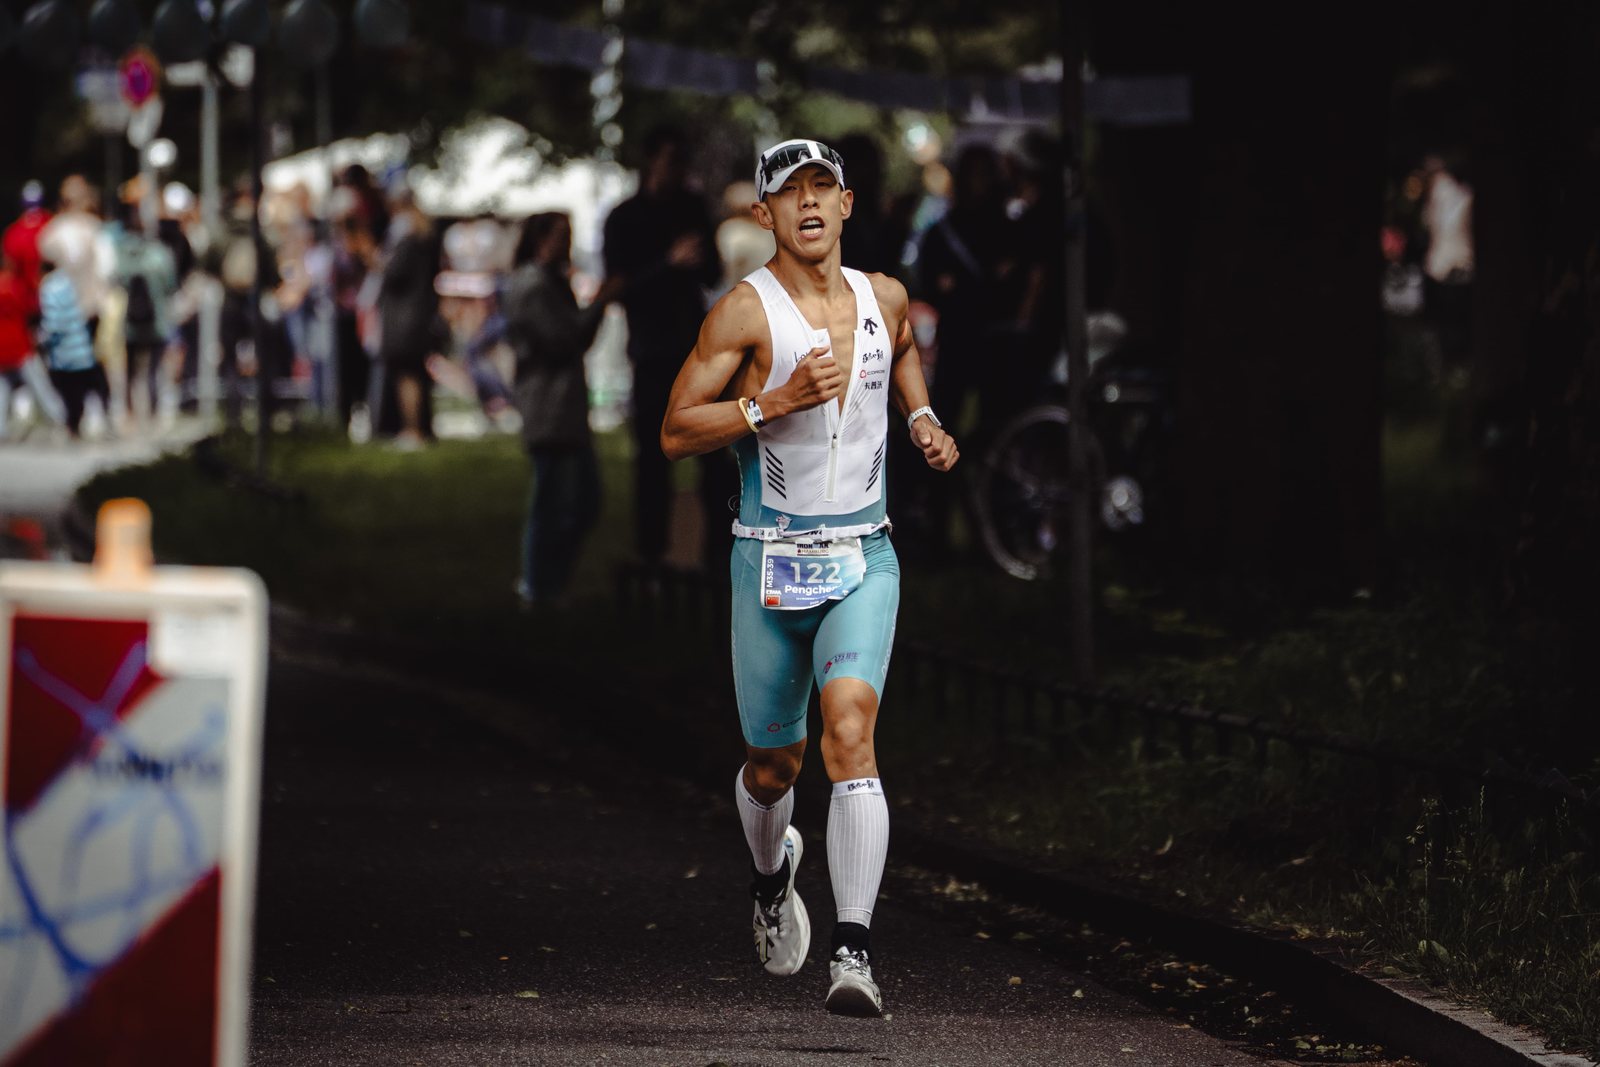
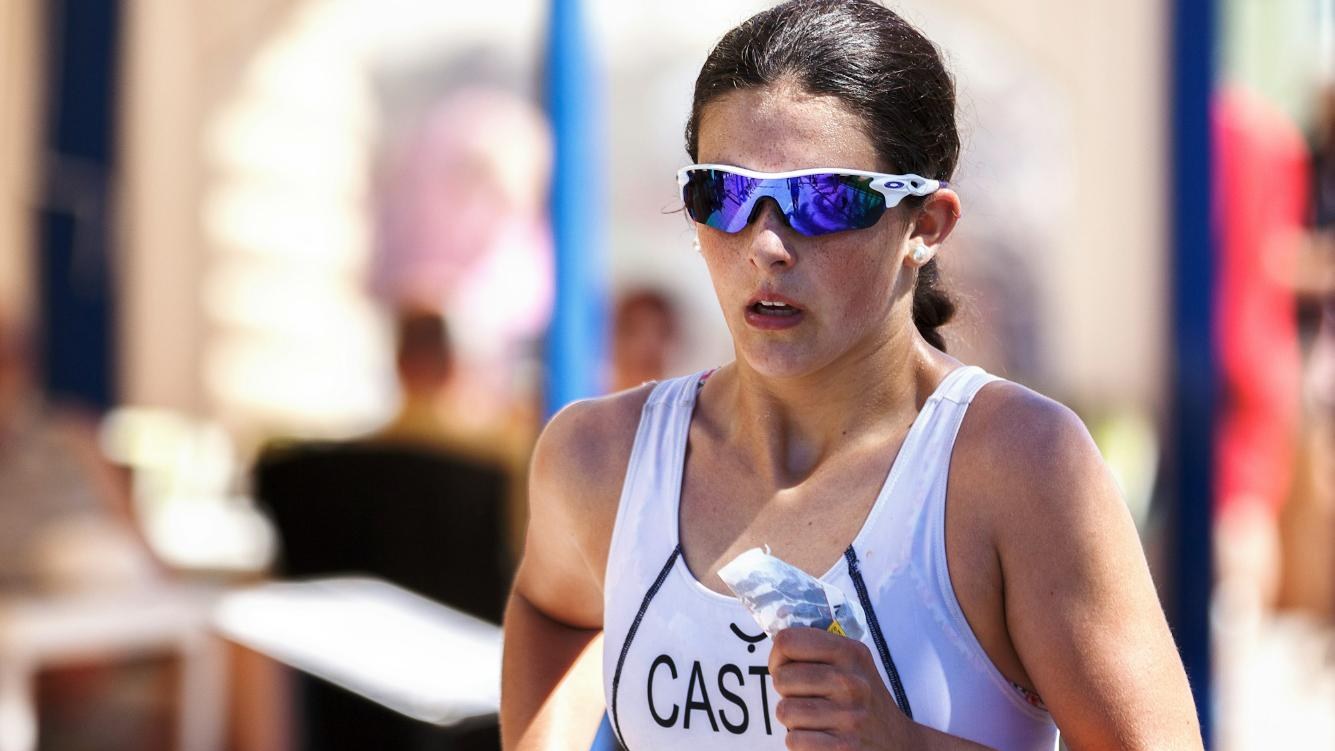
The gap was bigger than I expected. After 3 hours, the men's time-trial speed was down 9.9%. The women's was down only 1.1%. That's a gap of almost 9 percentage points. Put it in training terms: give a man and a woman the same long session, and late in it he's hanging on through sheer willpower while she's still sitting at the prescribed intensity.
By the way, the last author on this paper, Michele Zanini, is the first author of the "strength training improves durability" study I cited in the durability article. He's been working on this kind of question for the past several years.
The second one looked at cycling, which matters even more for us triathletes.[2] Sixteen men and sixteen women, all racing cyclists or triathletes. In plain terms, the protocol was "create fatigue, then test again." First, a ramp test for a baseline. A few days later, they came back for a 90-minute ride at tempo intensity (a lot harder than conversational pace; you can finish 90 minutes, but your legs will definitely ache when you get off the bike), then got retested right after.
After that 90-minute ride:
- The power you can cruise at for a long time (GET, gas exchange threshold, the aerobic threshold): men dropped 16%, women 2%
- What we usually just call "threshold" (RCP, respiratory compensation point): men dropped 13%, women 6%
Heart rate drift, blood lactate, and oxygen use during the ride were all clearly higher in the men, too. Same relative intensity, but the men's bodies paid a bigger price late in the ride.
What's interesting is that peak ability dropped just as much in both sexes. Sprint output and VO2peak fell for men and women alike, by the same amount. What the women held on to were the two submaximal markers, GET and RCP.
After 90 minutes on the bike, the sprint ceiling caved in just as hard for men and women. But the women's long-haul cruising power stayed right where it was, while the men's had dropped by more than 10%. And cruising power is what you use from start to finish in a long-distance race.
2. Why Do Women Fade More Slowly?
The cycling study's authors think men lose efficiency faster. There's a marker for this called VO2 drift. Picture holding a steady speed while your fuel consumption keeps climbing: power stays locked, but oxygen uptake slowly creeps up as fatigue builds, so the same watts cost more and more oxygen. That creep was clearly bigger in men than in women. If efficiency keeps leaking, the only way to stay at the same metabolic level is to give up some power.
Why does men's efficiency leak faster? In the durability article, I broke fading slowly into three things: sparing glycogen, the muscle fibers you were dealt, and neuromuscular fatigue resistance. Hold these two studies up against that list, and the first two have the most support right now.
First, glycogen. At the same relative intensity, women switch over to burning fat earlier, which amounts to automatically making deposits in the glycogen bank. Men burn through sugar hard early on, and when they're forced to slow down late, that looks more like a sign they're running out of sugar to burn.
Second, muscle fibers. Meta-analyses keep pointing at the same thing: women have a higher proportion of type I (slow-twitch, fatigue-resistant) muscle fibers than men.[3] A big 2025 meta-analysis of 156 studies and 6,222 people reached the same conclusion.[4] That fits with the sugar-sparing habit above. I have to be straight with you, though: neither experiment measured its subjects' muscle fibers. This link is an inference pieced together from other people's research.
Third, neuromuscular fatigue, where the two studies disagree. In the cycling study, both sexes dropped the same amount. In the running study, the men's knee extensors were down 18% by the second hour while the women's held steady, which may have to do with the eccentric pounding of running. I'm not drawing a conclusion yet. For a coach, that's actually good news: of the three, this is the most trainable one (it's exactly what strength and plyometric training work on). Whichever study turns out to be right, the answer is to train it.
| The three things behind fading slowly | What these two studies saw | What kind of evidence |
|---|---|---|
| Sparing glycogen | Women switch to fat earlier and bank glycogen; men burn sugar hard and fade more late | Measured through gas exchange in both studies, same direction; usage is estimated, no muscle biopsies |
| The muscle fibers you were dealt | Women have a higher share of type I fibers (51.4% vs. 48.3%, 2025 meta-analysis) | Indirect: those are other people's samples; neither study measured its subjects' fibers |
| Neuromuscular fatigue resistance | Cycling study: MVC down 16% in both sexes. Running study: men's knee extensors down 18%, women's held | Measured directly in both, but the results don't match |
3. You Can See It in Races Too: 870,000 Berlin Marathon Runners
Outside the lab, what does race data say? A 2026 analysis of the Berlin Marathon had an almost scary sample size: 873,334 finishers across 27 race years, from 1999 to 2025.[5] They defined "hitting the wall" as running the second half at least 20% slower than the first. The men's hit-the-wall rate was 17.63%, the women's 9.66%. Nearly double.
The biggest gap is in the sub-3 group: men 1.42%, women 0.23%, roughly a sixfold difference. Hitting the wall gets rarer the faster the group, yet the gap between the sexes is widest in the group that's most careful about pacing. Of course, finish data can't separate physiology from behavior (going out too hard will make you hit the wall too), so Berlin only counts as supporting evidence. The lab shows the difference exists. Berlin shows you can see it in real races.
Durability measures how little you lose. How high you start is a separate question. The gap between men's and women's world records has sat at 10 to 11% for years. It shrinks as races get longer, and one review of ultra-endurance events put it at about 4%.[6] At the Cocodona 250 ultra this May, Rachel Entrekin went as far as becoming the first woman in the race's history to win outright, in 56:09:48, 2.3% faster than the first man. For now, though, that's still a one-off.
So here's the precise way to put it: the durability advantage only shows up when the starting point is the same. Take a man and a woman with exactly the same 5K time and put them in a race that takes half a day, and I'd bet on the woman, because she'll lose less late in the race. Elite against elite is a different premise from the start. The fastest man starts about 10% higher than the fastest woman, and durability only kicks in late, so it can't make up that gap. There's one more thing I have to be honest about. The longest of these experiments ran just over three hours. A full-distance race (226 km) takes 9 to 17 hours. At that scale, whether fueling, gut trouble, or heat swamps the sex difference is something nobody has studied yet.
4. So What Can Coaches and Athletes Take From This?
I have four recommendations, and they all boil down to one thing: every training number you use should first be checked against the fatigued version of you, and the fatigued version of you depends on your sex.
Between research and training there are four layers, and only the last one really counts:
First, stop using fresh threshold numbers to plan the back half of long sessions. Just 90 minutes of tempo riding was enough to drop men's aerobic threshold power by 16%, and our long rides go way past 90 minutes. Three hours into a long ride, what you think is a tempo ride has probably drifted above threshold long ago, especially for men. Quality work late in a long session should have its zones adjusted down to begin with, or be cross-checked against RPE and heart rate.
Second, the "how much you slow down" yardstick may need a separate version for each sex. The yardstick from the durability article (standalone marathon vs. full-distance marathon split: about 10% slower is strong, 20% is average, 30% or more needs work) came from my own data, which is mostly men. If the sex difference holds up in races too, the same 20% might be just a passing grade for a female athlete but pretty good for a male athlete: same number, two meanings. I don't have enough data on women yet to call it, so for now I'm filing it as something to come back and check.
Third, male athletes should pace races more conservatively. Even Berlin's sub-3 runners couldn't escape this sex difference, so a man won't lose anything by holding back a little. A negative split sounds conservative. Once you factor in that the back half is going to sag, though, it's the only honest way to do the math.
Fourth, when you write plans for female athletes, don't automatically assume "less volume." Late in the same long session, the men have long since been grinding above their zones while the women's power is still right where it was, so the women actually hit the prescribed intensity more closely. But sex is only a starting assumption before you build the plan. What really counts is her own data: give her the same long session and see how her power, heart rate, and pace move late in it. One red line, too: good durability and adequate energy availability are two separate things. As you add volume, keep an eye on fueling, iron, and menstrual status at the same time. Female athletes over 40 also have menopause in the mix. I've laid out how far the research can answer that question in "Can't Train Like You Used To After 40: Is It Really Menopause?"
Back to the question I left at the end of the durability article: at the same level of fitness, do women really have the edge in durability? Going by these two experiments, yes. And the gap is too big for pacing strategy to explain.
The last thing I want to say has less to do with who lasts longer. In that article I said durability is both trainable and measurable. These two experiments fill in the other half: the hand you were dealt was never the same as the person's next to you. Your muscle-fiber mix, whether you lean toward burning sugar or fat: those cards were in your hand before you ever signed up for a race. What you can do is max out the parts of those three things that you can train.
References:
- Jaén-Carrillo, D., Bruce, C. D., Lawley, J. S., & Zanini, M. (2026). Highly Trained Female Runners Show Greater Durability and Physiological Resilience Than Performance-Matched Male Counterparts. Scandinavian Journal of Medicine & Science in Sports, 36(5), e70299. https://doi.org/10.1111/sms.70299
- Pastorio, E., Spillane, P., Squires, E., Benyahia, L., Wilson, H. K., Swain, P., ... & Ansdell, P. (2026). Sex Differences in Durability Following Heavy Intensity Cycling Exercise in Trained Athletes. Scandinavian Journal of Medicine & Science in Sports, 36(4), e70273. https://doi.org/10.1111/sms.70273
- Nuzzo, J. L. (2023). Sex differences in skeletal muscle fiber types: A meta-analysis. Clinical Anatomy, 37(1), 81–91. https://doi.org/10.1002/ca.24091
- James, J. J., Mellow, M. L., Bueckers, E. P., Gutsch, S. B., Wrucke, D. J., Pearson, A. G., Smith, A. E., & Hunter, S. K. (2025). Sex differences in human skeletal muscle fiber types and the influence of age, physical activity, and muscle group: A systematic review and meta-analysis. Physiological Reports, 13(21), e70616. https://doi.org/10.14814/phy2.70616
- Seffrin, A., Villiger, E., Andrade, M. S., Rosemann, T., Weiss, K., & Knechtle, B. (2026). Sex differences in marathon pacing: analysis of 873,000 Berlin marathon runners reveals men are twice as likely to "hit the wall". Scientific Reports, 16(1), 19529. https://doi.org/10.1038/s41598-026-56334-7
- Tiller, N. B., Elliott-Sale, K. J., Knechtle, B., Wilson, P. B., Roberts, J. D., & Millet, G. Y. (2021). Do Sex Differences in Physiology Confer a Female Advantage in Ultra-Endurance Sport? Sports Medicine, 51(5), 895–915. https://doi.org/10.1007/s40279-020-01417-2
Editor's note (technical details, for readers who want to dig deeper): In the running study, the 11 men and 11 women were matched by ITRA performance index, all at the Advanced 1 level (men 703 points, women 579, each in the same tier within their own sex). The cycling study matched by VO2peak cutoffs (men ≥55, women ≥48 mL/kg/min, which work out to equivalent performance levels). Ride intensity was set at 110% of GET power (the heavy-intensity domain; men 247 W, women 149 W), and actual oxygen uptake came out at 112.7% of GET oxygen uptake (p = 0.982). The women's 2% post-ride GET drop didn't reach statistical significance (p = 0.460). At the peak end, Pmax dropped 10%, VO2peak 7%, and peak lactate 45%, with no difference between the sexes; in the cycling study, MVC dropped 16% in both sexes. VO2 drift was 4.30 mL/kg/min in men vs. 2.51 in women. This "drift" is a different thing from the VO2 slow component: 90 minutes of drift also mixes in cardiovascular drift, rising body temperature, and dehydration. Limitations both studies share: small samples (11+11 and 16+16); they matched time and relative intensity, not total work (in the same 3 hours the men covered 16% more distance, and the conclusion held after statistical adjustment); and menstrual cycle and hormones weren't accounted for. The Berlin analysis only includes finishers (so the hit-the-wall rate is underestimated) and didn't measure any psychological variables, so "men pace more aggressively" is still a hypothesis waiting to be tested. Don't read the sub-3 group's 6.1× as a risk multiplier: both absolute rates are very low, and when the base is that small the ratio gets inflated. It says "27 race years" because the 2020 race was canceled. Slowdown from 35–40 km relative to 5–10 km: men +17.8%, women +12.6%. One more practical detail for coaches: in the running study, the sex difference was obvious in the time-trial segments but hard to see during the steady running. If you want to test durability, a time trial is more sensitive than steady cruising.
Editor's note: The full text of the running study (Jaén-Carrillo et al.) is open access (PMC), and figures like 9.9% and 1.1% come from the main text. Process data for the cycling study (Pastorio et al.) come from the authors' full public preprint; the final version has been published in the same journal, 36(4). The Berlin Marathon data come from the main text of the paper. The Cocodona 250 result comes from official results and race coverage. This article is general training education; individual training prescriptions still need to be tailored to each athlete's fitness, injury history, and goals.